How To Install Suricata in OCI and send the logs to Logging Analytics
Suricata is an open-source network threat detection engine that provides real-time intrusion detection (IDS), prevention (IPS), and network security monitoring (NSM). This guide is create to show how to install Suricata in Oracle Cloud Infrastructure (OCI) instance on Ubuntu 20.04 as an IDS.
Install and OCI Logging Config
1 — Provision OCI’s Ubuntu Instance in the VCN that you want to monitor:
Compute →Instances → Create Instance

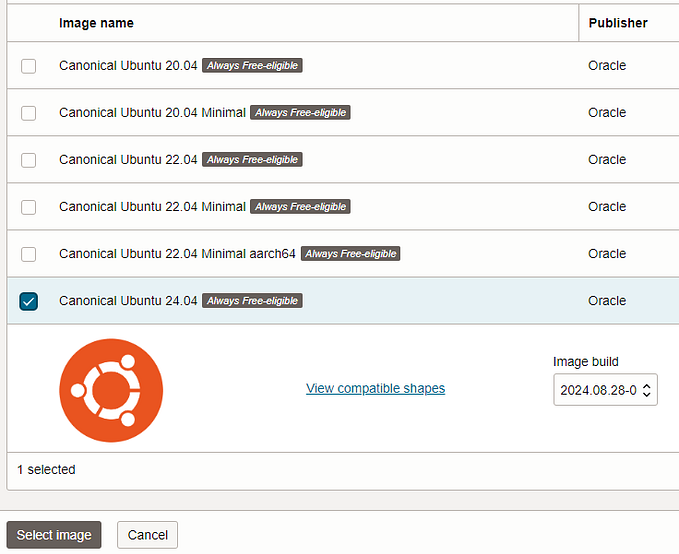
Give the instance a name, select the AD, Select the OS Canonical Ubuntu 20.04 and the Shape (2 OCPU and 32 GB RAM)


If you want to use a cloud init script, click on Show Advanced Options and paste the cloud init:


Press next and select the VCN, add the ssh keys and start the instance.

2- Add the Suricata Repository
To install Suricata, first, add the Open Information Security Foundation’s (OISF) software repository. This ensures that you get the latest stable version.
Run the following command to add the repository to your system:
sudo add-apt-repository ppa:oisf/suricata-stablePress ENTER when prompted to confirm. This command will automatically update your package list after adding the repository.
3- Install Suricata
Now that the repository is added, install Suricata using the apt package manager:
sudo apt install suricata -yThis command will download and install Suricata along with any required dependencies.
4-Enable Suricata on Boot
To ensure Suricata starts automatically when your system reboots, enable the service using systemctl:
sudo systemctl enable suricata.serviceYou should see output similar to:

suricata.service is not a native service, redirecting to systemd-sysv-install.
Executing: /lib/systemd/systemd-sysv-install enable suricata
5 — Stop Suricata Before Configuration
Before configuring Suricata, stop the service to prevent conflicts while editing its configuration files:
sudo systemctl stop suricata.serviceWith Suricata installed and stopped, you can now proceed to configure it for your specific network monitoring needs.
6- Configuring Suricata for the First Time in OCI
Suricata is installed in IDS mode by default(IPS mode not tested in OCI), meaning it will log but not drop traffic. This mode is recommended while you learn Suricata and analyze the traffic it detects.
Enabling Community Flow ID (Optional)
If you plan to integrate Suricata with tools like Zeek or Security Onion (Elastic Search), enabling the Community ID feature is useful for correlating records.
Edit the Suricata configuration file:
sudo nano /etc/suricata/suricata.yamlFind the Community Flow ID section (around line 120) and enable it by setting:
community-id: trueSave and close the file (CTRL+X, then Y, then ENTER).
7 — Identifying the Network Interface
By default, Suricata inspects traffic on eth0. However, OCI instances may use different interfaces such as enp0s5. Also it’s recommended to add an additioan VNIC and add the traffic on that VNIC. Use the Step 2 from https://medium.com/learnoci/how-to-install-arkime-moloch-using-embedded-open-search-19a7a58f8eff

Get the script to add and configure 2nd VNIC and find the correct interface to monitor the traffic:
curl https://raw.githubusercontent.com/oracle/terraform-examples/2f2c97f92bf2e4ca89ed906bfdecc878fbc33e25/examples/oci/connect_vcns_using_multiple_vnics/scripts/secondary_vnic_all_configure.sh -O
chmod +x secondary_vnic_all_configure.sh
sudo ./secondary_vnic_all_configure.sh -c
ip a

Edit the Suricata config file:
sudo vi /etc/suricata/suricata.yamlFind the af-packet section (around line 622) and modify:
- interface: enp1s0
    cluster-id: 99
If monitoring multiple interfaces, add additional entries:
- interface: ens05
    cluster-id: 98
Save and close the file.
8- Enabling Live Rule Reloading
Suricata allows live rule reloading without restarting the service. Enable this by adding the following at the bottom of the config file:
detect-engine:
  - rule-reload: true
Now, you can reload rules without restarting Suricata using:
sudo kill -USR2 $(pidof suricata)9- Updating Suricata Rules
Download the latest ruleset using:
sudo suricata-update
To enable additional rulesets:
sudo suricata-update enable-source tgreen/hunting
sudo suricata-update
10-Validating Configuration
Test the configuration before restarting Suricata:
sudo suricata -T -c /etc/suricata/suricata.yaml -v
Add VTAP port in iptables:
sudo vi /etc/iptables/rules.v4
sudo iptables-restore < /etc/iptables/rules.v4-A INPUT -p udp -m state --state NEW -m udp --dport 4789 -j ACCEPTAdd Suricata 2nd VNIC to VTAP NLB:

Create a new VTAP to test traffic on Suricata primary IP and run tests:

If successful, restart Suricata:
sudo systemctl restart suricata11-Running Suricata
Start Suricata in daemon mode:
sudo systemctl start suricata
sudo systemctl status suricata
Monitor logs to verify functionality:
sudo tail -f /var/log/suricata/suricata.log12-Testing Suricata Rules
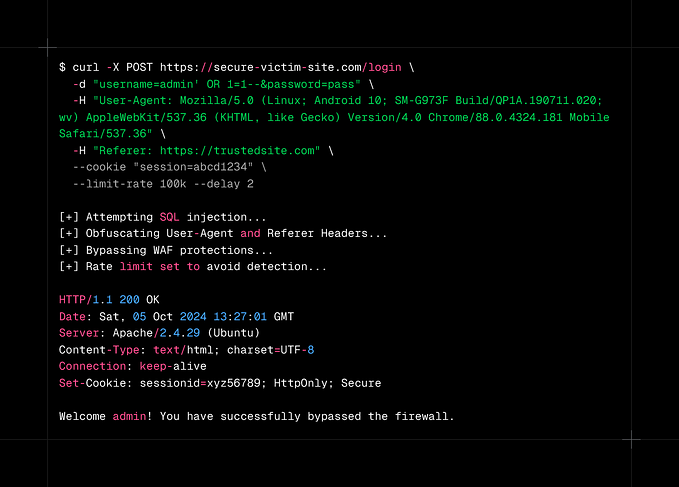
Use this page to do some tests:
Check logs for alerts:
curl -sSL https://raw.githubusercontent.com/3CORESec/testmynids.org/master/tmNIDS -o /tmp/tmNIDS && chmod +x /tmp/tmNIDS && /tmp/tmNIDS -99
grep /var/log/suricata/fast.log

For JSON logs view you can install jq for nicer view:
sudo apt install jq
jq 'select(.alert .signature_id==2100498)' /var/log/suricata/eve.json
13 — Import Suricata logs in OCI Logging ( We will create a separate blog on how to collect the Suricata Logs using Management Agent).
- Configure Agent configuration and point to /var/log/suricata/eve.json following this documentation https://docs.oracle.com/en-us/iaas/Content/Logging/Concepts/viewing_custom_logs_in_a_compute_instance.htm
The eve.json log format used by Suricata is nested JSON, so the separator will be on new line \n

After this we will see the logs collected in OCI logging:

Send the logs and configure Logging Analytics
To do this, we will use Connector Hub and will send the Suricata Logs to a dedicated Suricata Log Group in OCI Logging Analytics:
1- In Logging Analytics create a new Log Group:
Administration → Log Groups → Create Log Groups :

Create a new connector Observability and Manageability → Logging →Connectors →Create Connector

In the connector, if you have more types of logs select the Type the name used in Agent Configuration like type=’com.oraclecloud.logging.custom.Suricatalogs’ :

In Logging Analytics , we need to create a Parser for the Suricata Logs, and also a Source using this guide.
For the simplicity of this exercise, I will use only the Alert logs, and I can filter them in logging using this query
search “ocid1.compartment.oc1..aYourCompartmentID/ocid1.loggroup.oc1.eu-frankfurt-1.amYourLoggingGroupIDryfmq/ocid1.log.oc1.eu-frankfurt-1.amaaYourLogIDja” | data.event_type=’alert’ | sort by datetime desc
Get the JSON from one Alert (this will be used to create the parser, and extended over time to add as many fields needed by the Security team). I will create a separate blog entry to describe the main fields needed for Event correlation, investigation, etc. available in the Suricata logs.
Go to Logging Analytics → Administration → Parsers and create a JSON Suricata Parser:

Next step is to create the Source:
Create a log source with the name which is same as the value of the key type. In our case is “com.oraclecloud.logging.custom.Suricatalogs”

Before adding the source the logs are added to OCI Unifies Schema logs.

After the Source creation, we have the new log Source:

Related to the Parsers, a better approach would be to create one for each event type like alert or flow.
‘Log Source’ = com.oraclecloud.logging.custom.Suricatalogs and Type = alert | timestats count as logrecords by ‘Log Source’ | sort -logrecords
We copy the original Log Content from Logging Analytics and we create a new parser just for alerts, so we can extract more fields from the log. With the logs available in Logan, we can create different widgets for Dashboards.

I hope this was useful, and ask additional questions, or different products that would be nice to have them integrated in Logging Analytics.